Hemodynamics
Pulmonary Arterial Pressure
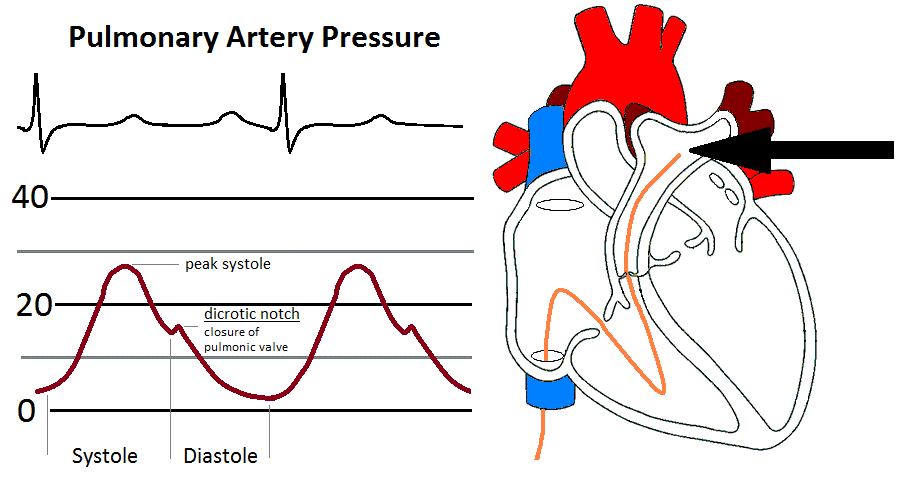
After PCWP and LV tracings are recorded, the balloon tip is deflated so that the Pulmonary Artery (PA) waveform can be analyzed. You will notice the systolic rise and diastolic fall of the arterial waveform. Systole begins with the opening of the pulmonic valve as blood rushes into the pulmonary artery from the right ventricle. As the volume of blood decreases, you will notice a descent in the waveform. As the pulmonic valve shuts, a small dicrotic notch is produced followed by a continual fall in the pressure through diastole until the next systolic ejection.
The PA is best viewed at a 40 or 50 mm Hg scale (dependent on what you monitor allows) at a speed of 25 mm/sec.
Components of the PA waveform
- Systolic rise - as blood is ejected from the right ventricle through the pulmonic valve into the pulmonary artery.
- Peak systole - as the waveform reaches maximal rise. This should be equal to the peak systolic pressure of the RV.
- Systolic decline as blood runs off through the pulmonary vasculature.
- Dicrotic notch - as the pulmonic valve shuts
- Diastolic descent as blood continues to flow through the pulmonary system.
- End diastole - right before the next systolic ejection - correlates with the PCWP.
The PA is recorded as: peak systole/end diastole/mean.
Normal PA systolic pressure is 20 - 30 mm Hg.
Normal PA diastolic pressure is 8 - 12 mm Hg.
Mean pressure can be calculated as: [(2 * diastolic) + systolic] / 3.
Reasons for elevated PA
- Increased pulmonary vascular resistance (PVR)
- Increased pulmonary venous pressure from mitral valve disease and LV failure
- Pulmonary disease
- Pulmonary Hypertension
- Pulmonary hypoxia
- Rapid heart rates elevate PA diastolic pressure with shortened diastolic period.
Complications when measuring PA
- Pulmonary artery rupture - rare but extremely serious complication.
- Arrythmias - related to right ventricular irritation from catheter.
- Dampening - when the catheter is positioned against the arterial wall.
Mixed Venous Blood Gas
Before the catheter is pulled back from the pulmonary artery into the right ventricle, a blood sample is pulled from the pulmonary artery for analysis. This blood sample is known as the mixed venous blood gas. It is a measurement of oxygen in the blood that has returned to the heart from the IVC, SVC and coronary sinus. By the time blood reaches the pulmonary artery, the "mixed" venous blood reveals how much oxygen remains after the body has removed it from the hemoglobin. The mixed venous blood gas helps to determine if the cardiac output and oxygen delivery is enough to meet the body's needs. The normal mixed venous blood gas oxygen saturation is 60 - 80%.
The mixed venous blood gas is an important value in calculating cardiac output by the FICK formula.
References
- Daily, E.K. and Schroeder, J.S. (1990) Hemodynamic Waveforms - Exercises in Identification and Analysis (2nd ed.). Philadelphia, PA: Mosby.
- Kern, M. et al (2003) The Cardiac Catheterization Handbook (4th ed.). Philadelphia, Pa: Mosby.